Platform 02 · Standfast
A whole line, a storm, and how close each tower comes to failure
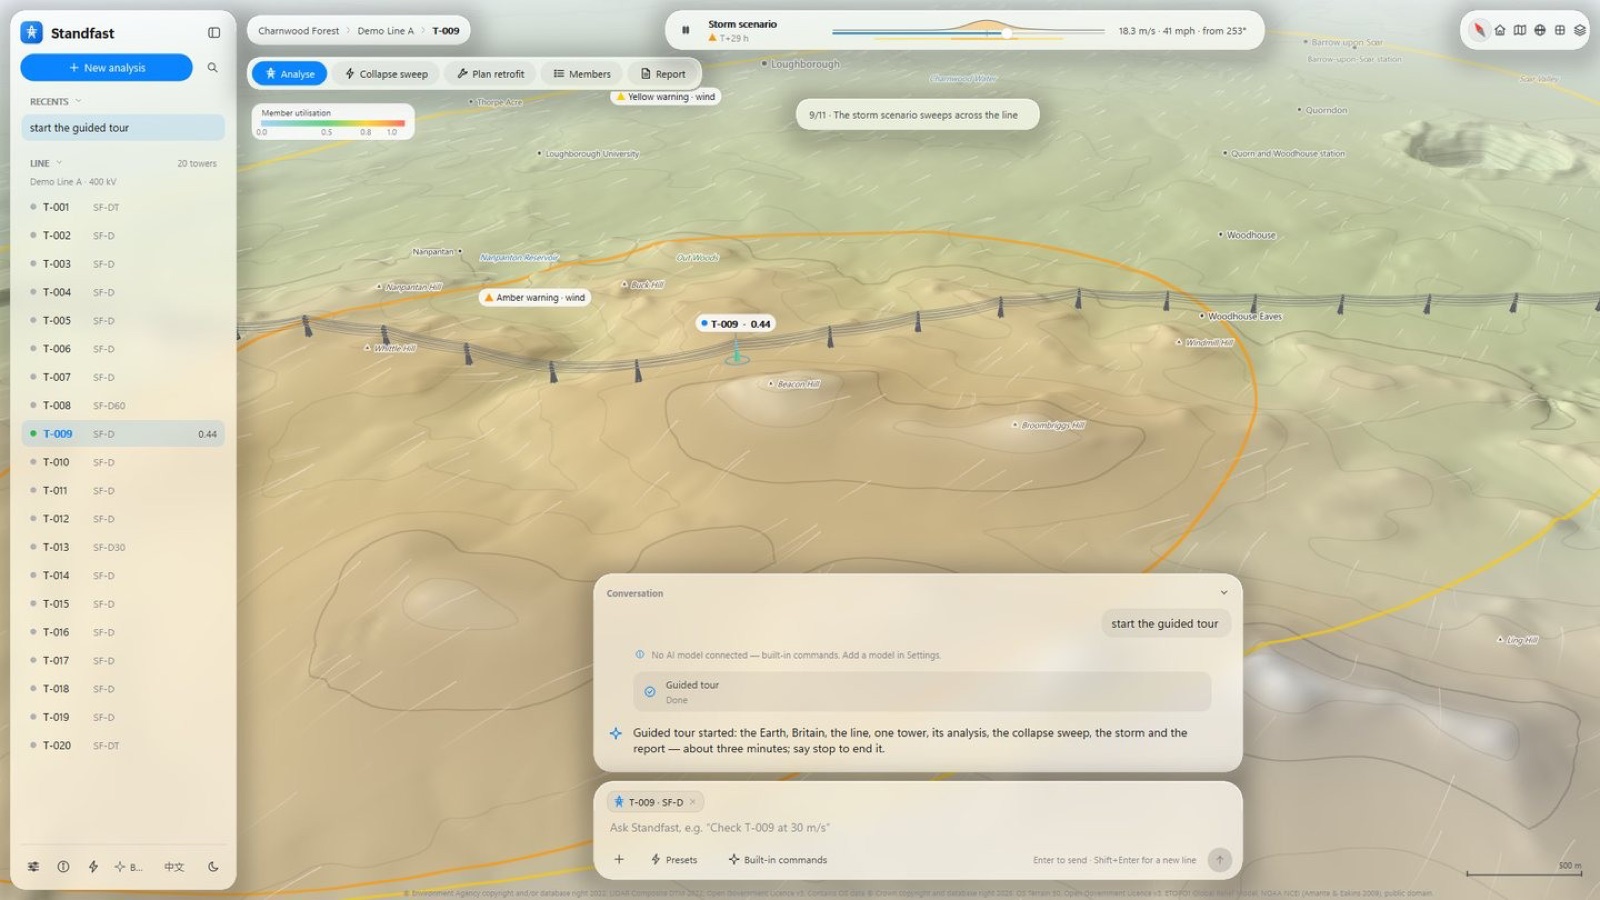
Standfast places an overhead line on real terrain, runs a storm across it and shows, tower by tower, the margin that remains. Then it compares strengthening options so the money goes where it buys the most margin.
Workflow
From scenario to engineer review
Scenario
The line, its towers and conductors on real terrain.
Storm
A storm sweeps across the line; warnings appear where they should.
Tower analysis
Finite-element analysis of one tower in about 15 seconds.
Wind chain
Site wind to member forces, to BS EN 1991-1-4 with the UK National Annex.
Collapse sweep
Wind speed stepped from 20 to 44 m/s to find each tower's limit.
Line screening
Every tower on the line ranked by remaining margin.
Strengthening
Retrofit options compared side by side, before and after.
Report and review
Report, evidence pack sealed with SHA-256, and a seven-step engineer review.
Conversation, not menus
Ask in plain language
Standfast can be driven from a conversation panel, connected to Claude or to a local model. The model only calls the same actions the buttons call, so a conversation and a click give the same answer. With a local model, data never leave the machine.
Standards and data
Checked against
- EN 50341-1 and BS EN 50341-2-9 for overhead lines
- EN 1991-1-4 with the UK National Annex for wind
- EN 1993-1-1, EN 1993-3-1, EN 10025-2, EN 10056-1 for steel
- ISO 9223 and ISO 9224 for corrosion
The demonstration line is fictional. Terrain, place names and weather inputs are real open data (OS Terrain 50, LiDAR, Met Office and others), used under the Open Government Licence or in the public domain. Design values marked provisional are shown as such.